
What IQ Is the Top 1%? Top 2%, 10%, and 0.1% Cutoffs at a Glance
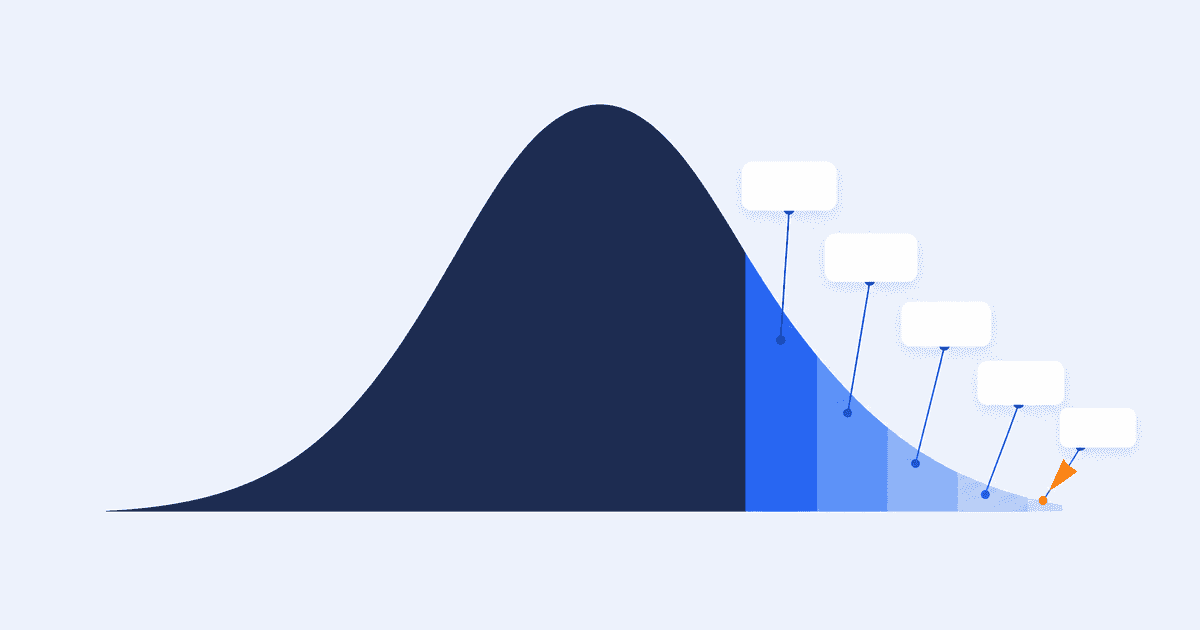
In brief: On a normal-distribution model with a mean of 100 and a standard deviation of 15, the top 1% in IQ starts at 134.9 (about 135, z = 2.326), which is roughly 1 in 100 people and a deviation score of 73.3. On the same model, the cutoffs are IQ 119.2 for the top 10%, 124.7 for the top 5%, 130.8 for the top 2%, and 146.4 for the top 0.1%. In whole numbers, IQ 135 and above is the top 0.98%, IQ 131 and above is 1.94%, and IQ 130 and above is 2.28%, so the gap between "top 2% = IQ 130" and "IQ 130 = top 2.3%" is a matter of rounding. Mensa's criterion is the top 2%, not a score; on an SD-16 test the same position is 133, and on SD 24 it is 149. All of these are theoretical values, not tallies of actual test takers.
On a normal-distribution model with a mean of 100 and a standard deviation of 15, the top 1% in IQ starts at about 135 (134.9 to be exact, z = 2.326), which is roughly 1 in 100 people and a deviation score of 73.3. Articles like the percentage for IQ 130 and the percentage for IQ 140 go forward from an IQ score to a top-X% figure; this article is a reverse-lookup table that starts from the percentage and asks what IQ you need. Every percentage here is a theoretical value on the normal-distribution model, not a tally of actual test takers.
What IQ is the top 1%, 2%, 10%, and 0.1%? A reverse-lookup table
Modern intelligence tests are standardized so that the mean for a same-age group is 100 and the standard deviation (SD) is 15 (Intelligence quotient - Japanese Wikipedia). Under that assumption, the cutoff for the top p% can be computed by finding the z-value whose upper-tail probability on the standard normal distribution is p, then converting back with IQ = 100 + 15 × z. The results from the top 50% down to the top 0.01% are below, with the z-value and deviation score in parentheses. Score-by-score details are collected in the IQ reference table.
- Top 50%: IQ 100.0 (z = 0, deviation score 50.0). Exactly the mean, 1 in 2 people
- Top 25%: IQ 110.1 (z = 0.674, deviation score 56.7). 1 in 4 people
- Top 10%: IQ 119.2 (z = 1.282, deviation score 62.8). 1 in 10 people
- Top 5%: IQ 124.7 (z = 1.645, deviation score 66.4). 1 in 20 people
- Top 2%: IQ 130.8 (z = 2.054, deviation score 70.5). 1 in 50 people, the Mensa criterion
- Top 1%: IQ 134.9 (z = 2.326, deviation score 73.3). 1 in 100 people
- Top 0.5%: IQ 138.6 (z = 2.576, deviation score 75.8). 1 in 200 people
- Top 0.1%: IQ 146.4 (z = 3.090, deviation score 80.9). 1 in 1,000 people
- Top 0.01%: IQ 155.8 (z = 3.719, deviation score 87.2). 1 in 10,000 people
As the table shows, the top 2% cutoff is 130.8 and the top 1% cutoff is 134.9; neither is a whole number. Rounded, they become "top 2% = IQ 130" and "top 1% = IQ 135", but if you go forward from whole-number IQs, IQ 130 and above is the top 2.28% (about 1 in 44), slightly over 2%, and the lowest whole number that fits inside the top 2% is IQ 131 (top 1.94%). That is why lists of high-IQ societies give Mensa's criterion as "IQ 131 and above" (High IQ society - Japanese Wikipedia), and it does not contradict "IQ 130 is the top 2.3%".
The top 1% works the same way: IQ 135 and above is the top 0.98% (about 1 in 102), while IQ 134 and above is 1.17%, so the lowest whole number that fits inside 1% is 135. For the top 0.1%, the cutoff is 146.4; IQ 146 and above is the top 0.11% (about 1 in 924) and 147 and above is 0.09%, which is why sources give it as either 146 or 147. The forward direction (IQ to top X%) is covered in the score-by-score articles from the percentage for IQ 120 to the percentage for IQ 150.
How to calculate it: converting to z-values and deviation scores
The calculation has two steps. First, z = (IQ − 100) ÷ 15 converts the IQ into a z-value (how many standard deviations it sits from the mean); for IQ 135 that is 2.33. Next, find the area above z on the standard normal distribution (the upper-tail probability). This cumulative distribution function has no closed-form expression and is computed numerically (NIST/SEMATECH e-Handbook: Normal Distribution), so you use something like the NORM.S.DIST function in a spreadsheet.
The reverse lookup runs the other way: from the upper-tail probability p, find z (NORM.S.INV(1 − p)) and convert back with IQ = 100 + 15 × z. The deviation score comes from the same z-value with deviation score = 50 + 10 × z, giving 73.3 for the top 1% (z = 2.326), 70.5 for the top 2%, 62.8 for the top 10%, and 80.9 for the top 0.1%. That is only the same normal distribution read on a different ruler, though, and it cannot be compared directly with the academic deviation scores from practice exams, whose population and content are both different. A conversion table is in converting between IQ and deviation scores.
How many people in Japan are in the top 1% and top 0.1%?
Let's turn the shares into head counts. According to the population estimates from the Statistics Bureau of Japan (Ministry of Internal Affairs and Communications), Japan's total population as of August 1, 2026 was a provisional 122.68 million (Population Estimates - Statistics Bureau of Japan). Multiplying by the shares gives about 2.45 million people in the top 2%, about 1.23 million in the top 1%, about 120,000 in the top 0.1%, and about 12,000 in the top 0.01%. In everyday terms, the top 1% is one person in a workplace or school year of 100, and the top 0.1% is one person in a group of 1,000.
These are illustrations of "total population × share", though, not counts showing that this many such people actually exist. Because intelligence tests are standardized against a same-age group, multiplying a share by a total population that runs from infants to the elderly is only a calculation for getting a sense of scale, and no data set exists in which every person in Japan took the same test.
What is Mensa's "top 2%" on SD 16 and SD 24? The scale trap
"Mensa starts at IQ 130" is a common line, but the criterion is a percentage, not an IQ score. JAPAN MENSA's admissions page says that anyone recognized as scoring within the top 2 percent of the general population can become a member, and it gives no specific score (JAPAN MENSA admissions guide). Proof comes through two routes, the admission test or documented WAIS or WISC results from within one year before applying; for procedures and fees, see how to join Mensa (they are subject to revision, so confirm on the official page).
Converted to SD 15, the top 2% cutoff is 130.8, or IQ 131 and above in whole numbers. Mensa International likewise requires a score in the top 2% of the general population on an approved intelligence test, and states explicitly that online tests cannot be used for admission (Mensa International: Getting your IQ tested FAQs).
The same "top 1%" or "top 2%" turns into a different IQ number when the test uses a different standard deviation. The top 1% cutoff (z = 2.326) is 134.9 on SD 15, 137.2 on SD 16, and 155.8 on SD 24. The top 2% (z = 2.054) is 130.8 on SD 15, 132.9 on SD 16, and 149.3 on SD 24.
That is why Mensa cites a different top-2% benchmark for each test: 130 on the WAIS, 132 on the Stanford-Binet, and 148 on the Cattell scale (SD 24) (Mensa - Japanese Wikipedia). All three are the "mean + 2 SD" point on their respective scales (top 2.28%), conventional values rounded slightly leniently from the exact top-2% cutoffs of 130.8, 132.9, and 149.3. Before comparing an IQ figure of unknown scale with the table above, always check which scale it is on.
The criteria of other high-IQ societies sit on the same axis: Intertel, at the top 1%, is listed as 135 on SD 15, and the Triple Nine Society, at the top 0.1%, as 147 (High IQ society - Japanese Wikipedia). The latter's official requirement is an IQ three standard deviations above the mean (Triple Nine Society), and +3 SD (IQ 145) is the top 0.135%, a slightly more lenient standard than the 0.1% cutoff of 146.4. The 147 in the list is a different rounding choice, the whole number that fits inside 0.1%.
One test cannot confirm that you are in the top 1%
The cutoffs above are given to one decimal place, but real measurement is not that precise. Even on a standardized intelligence test, the 95% confidence interval for the full-scale IQ is roughly ±5 points (a standard error of measurement of about 2 to 3 points), so a result of IQ 135 is an estimate with a range: the true value is somewhere around 130 to 140. The top 1% cutoff of 134.9 and the top 2% cutoff of 130.8 are only 4 points apart, and IQ 133 and 137 cannot be distinguished statistically, so a single result cannot settle whether you are in the top 1%.
On top of that, tests have a ceiling effect, since the number of hard items is limited, and their ability to discriminate drops the further above the top 1% you go. Read the top 1% and top 0.1% figures as a guide meaning "you probably fall in this band", and if you need more, the realistic approach is to look at several results taken on different days. An intelligence test is not itself a developmental or medical diagnosis; for that purpose, get an assessment from a medical or specialist institution.
The reliable way to check what top X% your own score falls in is to measure it on the same SD-15 scale. BrainRank's free IQ test scores 20 questions (about 10 minutes) across four domains, spatial reasoning, pattern recognition, logical reasoning, and classification, using item response theory (IRT), and returns an estimated IQ, deviation score, and top-X% figure on the same mean-100, SD-15 scale used in this article (taking the test is free; viewing results including the estimated IQ is a one-time payment of ¥300, tax included, with no subscription or auto-renewal (the result can be reopened for 24 hours after it is first shown, and saved as an image or PDF during that window)). You can check the result against the IQ reference table and the IQ distribution table. It is an estimate for entertainment and self-understanding, not a medical or diagnostic test.
Frequently asked questions
- What IQ do you need to be in the top 1%?
- On a normal-distribution model with a mean of 100 and an SD of 15, the top 1% cutoff is IQ 134.9 (z = 2.326); in whole numbers, IQ 135 and above is the top 0.98%, about 1 in 102 people. That converts to a deviation score of 73.3. On an SD-16 test the same position is 137, and on SD 24 it is 156, so check the scale before comparing with other figures.
- What deviation score is the top 1% in IQ?
- Converting with deviation score = 50 + 10 × z, the top 1% (z = 2.326) is a deviation score of 73.3. Likewise, the top 2% is 70.5, the top 10% is 62.8, and the top 0.1% is 80.9. These are the same normal distribution read on a different ruler, though, and cannot be compared directly with the academic deviation scores from practice exams, which draw on a different population and measure different content.
- What IQ do you need to join Mensa?
- JAPAN MENSA's criterion is a score within the top 2% of the general population; it is not defined as an IQ number. Converted to the mean-100, SD-15 scale, the cutoff is 130.8, or IQ 131 and above in whole numbers, and on the Cattell scale (SD 24) the benchmark is given as 148 (mean + 2 SD). Proof of eligibility comes through two routes only, JAPAN MENSA's admission test or documented WAIS or WISC results from within one year before applying; nothing outside those two routes (such as online tests) is accepted, as Mensa International's FAQ also states explicitly.
Share this article
Related articles
- What Is Borderline Intellectual Functioning? IQ 70–84 and 1 in 7
- What Percentage Has an IQ of 160? The Top 0.003%, About 1 in 31,560
- Is an IQ of 90 Low? How to Read a Score Inside the Average Range
- What Is an AI's IQ? Why a Score Above 140 Can't Be Compared to a Human's
- Is Average IQ by Country Reliable? The Limits Explained
- How to Read WISC-V Results: FSIQ, Index Scores and Discrepancies
Editorial note & disclaimer
BrainRank Editorial Team
This article was written and edited by the BrainRank Editorial Team with reference to academic literature on psychometrics, including CHC theory and Item Response Theory (IRT). Statistics and percentages are calculated from a normal distribution model with a mean of 100 and a standard deviation of 15.
The tests on this site provide estimates for entertainment and self-understanding purposes only. They are not medical or clinical assessments, nor official psychological (intelligence) tests.