
What Percentage Has an IQ of 160? The Top 0.003%, About 1 in 31,560
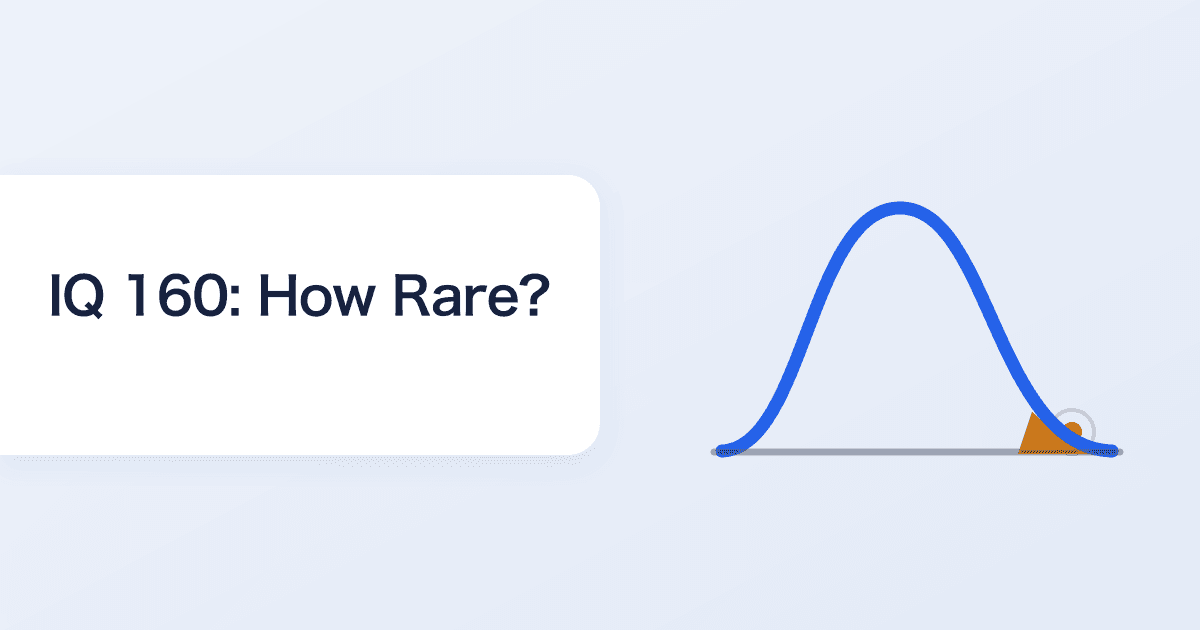
An IQ of 160 puts you in roughly the top 0.003%, about 1 in 31,560 people. On a normal distribution with a mean of 100 and a standard deviation of 15 (SD 15), it sits exactly +4 standard deviations above the mean, which converts to a deviation score of precisely 90. This article covers where those numbers come from and the problem specific to this band: the figures stop being trustworthy.
The core numbers for IQ 160 (mean 100, SD 15)
Running IQ 160 through the SD-15 normal distribution model gives:
- Standard score (z): +4.00
- Top: about 0.003%
- Rarity: about 1 in 31,560
- Deviation score: 90.0
All of these follow arithmetically from the definition of a normal distribution with a mean of 100 and an SD of 15 — no additional survey data required. The same calculation across every score is laid out in our IQ reference table, and the population share of each band is collected in our IQ distribution data.
Rarity shifts by an order of magnitude every 15 points
The defining feature of the high-IQ range is that rarity grows exponentially against a linear rise in score. Lined up on the SD-15 model:
- IQ 115: about 1 in 6 (top 15.87%)
- IQ 130: about 1 in 44 (top 2.28%)
- IQ 145: about 1 in 741 (top 0.13%)
- IQ 160: about 1 in 31,560 (top 0.003%)
From 115 to 130 the multiplier is about 7×; from 130 to 145, about 17×; from 145 to 160, about 43×. The same 15-point width buys progressively more rarity the higher you go. An IQ of 160 is a handful of people per mid-sized city.
Most claimed 'IQ 160' figures are on a different ruler
The IQ 160 figures you see online and in books mix scales. Some tests and high-IQ societies use SD 24, on which an IQ of 160 is +2.5 standard deviations — roughly the top 0.6%, about 1 in 160. Converted to SD 15, that is approximately IQ 137.
So the same number 160 means 1 in 31,560 on SD 15 and 1 in 160 on SD 24 — a rarity difference of about 200×. Always check the standard deviation behind a figure. Everything on this site is standardized to SD 15 (see methodology). Why IQ values attributed to historical figures are unreliable is covered in famous people's IQ.
At this level, measurement error is the larger effect
The most important point about IQ 160 is that standard intelligence tests are not built to measure this band precisely. Every test has a ceiling set by how many items of that difficulty it contains, and few instruments carry enough hard items to discriminate at +4 SD.
On top of that, the standard error of measurement on a standard test is around ±5 points. IQ 155 and IQ 165 are therefore statistically hard to tell apart, and treating a single result as a fixed value does not hold up. The same caveat runs through what percentage has an IQ of 150 and how accurate are free IQ tests.
Statistical rarity is not achievement
The top 0.003% is a position in a distribution, not a guarantee of outcomes. IQ does correlate with occupational success, but not decisively — effort, opportunity, and accumulated domain expertise matter as much or more (see IQ and income).
Measure yourself on the same ruler
The meaning of a figure like IQ 160 only becomes comparable once you measure yourself on the same scale. BrainRank's free IQ test is 20 questions in about 10 minutes, scored with item response theory (IRT), producing an estimated IQ, deviation score, and percentile on the same mean-100, SD-15 scale used throughout this article. No signup, and you also see your domain-by-domain profile.
Share this article
Related articles
- What Is Borderline Intellectual Functioning? IQ 70–84 and 1 in 7
- What IQ Is the Top 1%? Top 2%, 10%, and 0.1% Cutoffs at a Glance
- Is an IQ of 90 Low? How to Read a Score Inside the Average Range
- What Is the WAIS? The Difference Between Formal IQ Tests and Free Online Tests
- What Percentage Has an IQ of 120? Top 9%, About 1 in 11
- How to Read WISC-V Results: FSIQ, Index Scores and Discrepancies
Editorial note & disclaimer
BrainRank Editorial Team
This article was written and edited by the BrainRank Editorial Team with reference to academic literature on psychometrics, including CHC theory and Item Response Theory (IRT). Statistics and percentages are calculated from a normal distribution model with a mean of 100 and a standard deviation of 15.
The tests on this site provide estimates for entertainment and self-understanding purposes only. They are not medical or clinical assessments, nor official psychological (intelligence) tests.