
The Dunning–Kruger Effect: Why Self-Assessment Misses, Seen Through IQ
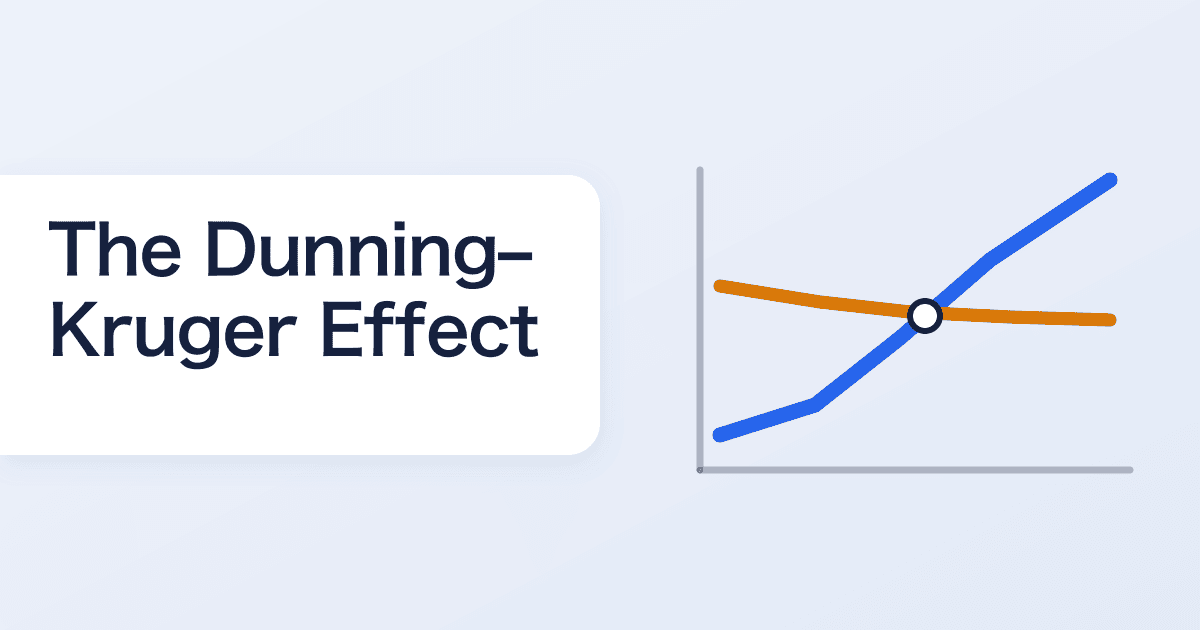
The Dunning–Kruger effect is often reduced to 'the less competent are the most confident.' What the original research showed is slightly more precise: self-assessment does not spread as far as actual ability does — it compresses toward the middle. This article covers what that means, and why self-reported IQ figures are unreliable.
What the original study found
Kruger & Dunning (1999) had participants complete tasks in logical reasoning, grammar, and humor judgment, then asked them to estimate their own percentile rank. The results were:
- Participants in the bottom 25% clustered their self-estimates far above their actual position
- Participants in the top 25% tended to place themselves somewhat below their actual rank
As the figure shows, actual scores fan out widely from bottom to top while self-assessment stays nearly flat, pinned near the middle. That top performers underrate themselves was just as important a finding as that bottom performers overrate themselves.
Why the gap is larger at the bottom
Dunning's explanation rests on metacognition. The ability to solve a task correctly and the ability to judge whether your own answer is correct draw on the same knowledge. When that knowledge is missing, you cannot notice that you are wrong in the first place.
The gap at the top has a different cause. Tasks that came easily to you feel like they should come easily to everyone (the false consensus effect), so you place your relative rank too low. The two tails are not the same phenomenon mirrored — they are separate mechanisms.
Know the statistical objection too
The effect draws statistical criticism as well. As long as both ability and self-assessment carry measurement error, regression to the mean occurs at the tails, pushing the bottom up and the top down — meaning part of the pattern in the figure can be reproduced without invoking any psychological explanation.
The reasonable current view sits in the middle: the regression effect is genuinely present, but a metacognitive component remains that regression alone does not account for. That caution is closer to the evidence than the confident popular summary.
Why self-reported IQ is unreliable
The effect shows up especially strongly around IQ. Self-reports like 'I'm around 140' diverge from measured values because several factors stack up:
- Self-assessment is compressed toward the middle and reflects ability poorly
- Different scales (SD 15 versus SD 24) get conflated (see what percentage has an IQ of 160)
- High scores on unnormed internet tests get taken at face value (see how accurate are free IQ tests)
The unreliability of IQ values attributed to historical figures has fundamentally the same structure (see famous people's IQ).
Practical ways to shrink the gap
Improving the accuracy of self-assessment is simpler than improving ability itself. First, work regularly on tasks that return objective right/wrong feedback — in domains with feedback, the self-assessment gap narrows. Second, write your estimate down as a number before you see the result, then compare. That makes the direction of your bias visible.
An IQ test works for this. Note down where you think you rank as a percentile before you sit it, and your estimation habits become obvious.
Test the gap on your own data
BrainRank's free IQ test scores 20 questions across spatial reasoning, pattern recognition, logical reasoning, and classification (about 10 minutes) with item response theory (IRT), reporting an estimated IQ, deviation score, and percentile on the mean-100, SD-15 scale. Compare your prior self-estimate against the result and you can check this article against your own data. Reading it alongside our IQ distribution data makes the position easier to interpret.
Share this article
Related articles
- ADHD and IQ: Is Average IQ Lower? WISC Profiles and High-IQ ADHD
- Autism and IQ: Intellectual Disability Rates and Test Profiles
- Does Reading Raise IQ? What Twin Studies and Meta-Analyses Show
- Is Multitasking Really Inefficient? The Real Cost of Switching
- Is Average IQ by Country Reliable? The Limits Explained
- How to Build Critical Thinking — and Where It Stops Working
Editorial note & disclaimer
BrainRank Editorial Team
This article was written and edited by the BrainRank Editorial Team with reference to academic literature on psychometrics, including CHC theory and Item Response Theory (IRT). Statistics and percentages are calculated from a normal distribution model with a mean of 100 and a standard deviation of 15.
The tests on this site provide estimates for entertainment and self-understanding purposes only. They are not medical or clinical assessments, nor official psychological (intelligence) tests.