
IQ and Academic Performance: What a Correlation of 0.5 Actually Means
Studies generally put the correlation between IQ and academic performance at around 0.5. As psychological measures go that is fairly strong, but it does not remotely mean IQ determines grades. This article works through what a correlation of 0.5 actually represents.
A correlation of 0.5 explains about a quarter
The square of a correlation coefficient (the coefficient of determination) is the share of variance in one variable explained by the other. At r = 0.5, r² = 0.25 — about 25% of the variance in grades is accounted for by IQ, leaving roughly 75% to other factors.
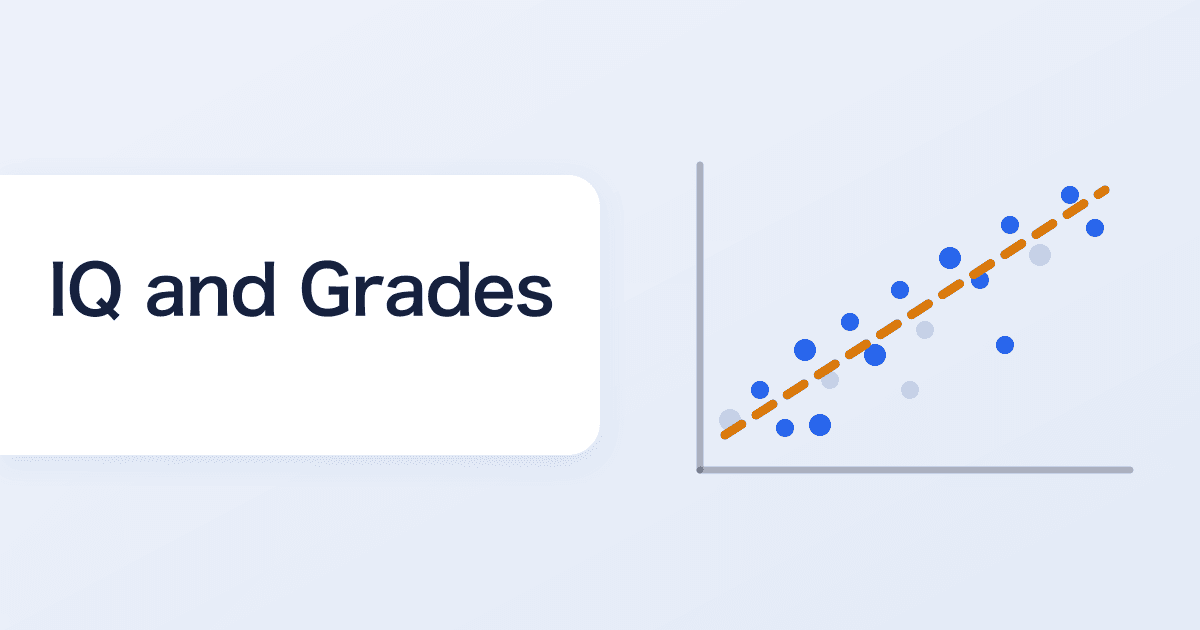
As the figure shows, a scatter at r = 0.5 slopes upward while the points scatter across a wide band. People with an average IQ who rank near the top of their class, and people with a high IQ whose grades lag, sit inside that band as a matter of course.
Where the correlation comes from
IQ tests measure the ability to spot new rules quickly (fluid reasoning) and accumulated knowledge and vocabulary (crystallized intelligence). Schoolwork demands exactly those two, repeatedly. Understanding the rules of a new unit and binding them to what you already know is structurally similar to the tasks on an intelligence test, and that similarity produces the correlation (see fluid and crystallized intelligence).
Working memory is especially load-bearing: holding key points while listening to an explanation and checking them against what you know depends heavily on short-term capacity (see how to train working memory).
What the remaining 75% consists of
Most of the variance in grades comes from factors other than cognitive ability. The ones research points to consistently include:
- Study time and study method (spaced practice and retrieval practice make a large difference)
- Personality traits such as conscientiousness
- Home learning environment and access to materials and instruction
- Interest in and motivation toward the subject
- Sleep and general health
Unlike composite IQ, these are largely movable by the student and the people around them. The same structure appears in the relationship between IQ and later income (see IQ and income).
The correlation tends to weaken at higher levels
The IQ–grades correlation is comparatively high in primary school and tends to soften through high school and university. The reason is simple: as you progress, selection narrows the ability range of the population being measured, and a restricted range mathematically shrinks a correlation.
This does not mean 'ability stops mattering at university.' It means that within a group of similar ability, the differences come from study time and method instead.
What to look at when grades lag
Even at an average composite IQ, the domain profile is always uneven. Someone strong in spatial reasoning learns better from diagrams; someone strong in verbal processing learns better by summarizing and explaining. Entering through the stronger channel is simply more efficient, and knowing your own unevenness is the clue for choosing a method.
Measure your own cognitive profile
BrainRank's free IQ test scores 20 questions across spatial reasoning, pattern recognition, logical reasoning, and classification (about 10 minutes) domain by domain. Beyond the composite estimate you learn which kind of reasoning you are strongest at, which is material for building a study approach. No signup, and results are reported on the mean-100, SD-15 scale.
Share this article
Related articles
- ADHD and IQ: Is Average IQ Lower? WISC Profiles and High-IQ ADHD
- Autism and IQ: Intellectual Disability Rates and Test Profiles
- Does Reading Raise IQ? What Twin Studies and Meta-Analyses Show
- What Is Metacognition? Meaning, Examples, and Three Ways to Train It
- Digital Dementia and the Smartphone Brain: What the Research Found
- How to Train Spatial Reasoning: Boosting Mental Rotation in Daily Life
Editorial note & disclaimer
BrainRank Editorial Team
This article was written and edited by the BrainRank Editorial Team with reference to academic literature on psychometrics, including CHC theory and Item Response Theory (IRT). Statistics and percentages are calculated from a normal distribution model with a mean of 100 and a standard deviation of 15.
The tests on this site provide estimates for entertainment and self-understanding purposes only. They are not medical or clinical assessments, nor official psychological (intelligence) tests.