
What Is Aphantasia? Prevalence and What It Does to Ability
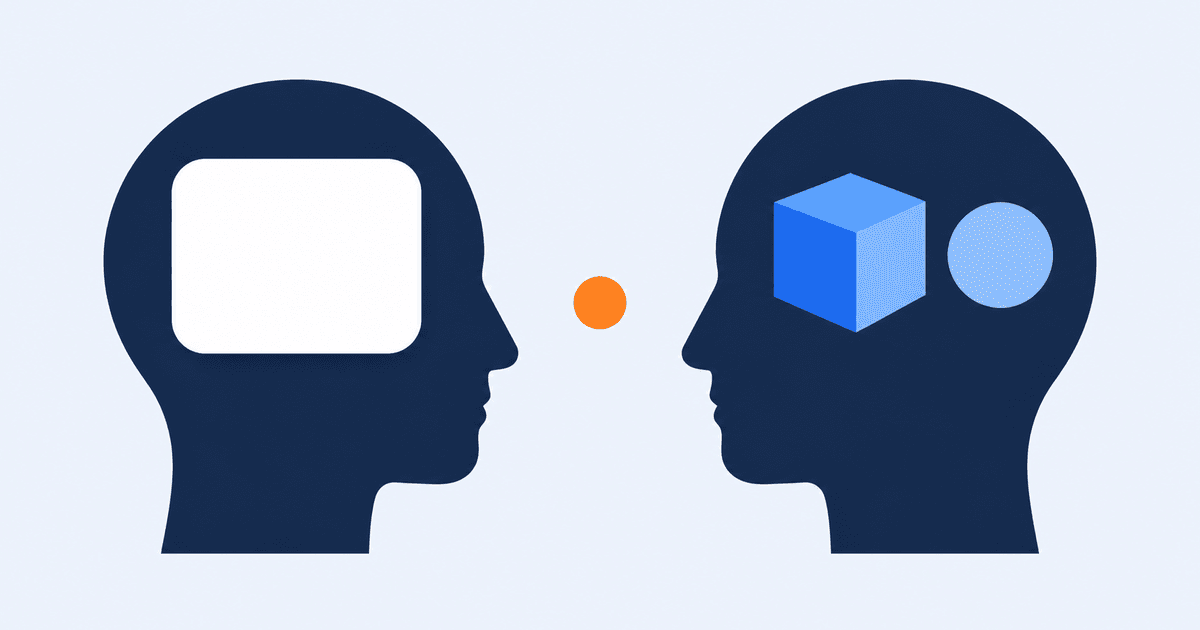
In brief: Aphantasia is the condition of producing no visual image even when deliberately trying to. In a general-population survey by Dance, Ipser, and Simner (2022), about 1% qualified, rising to roughly 4% when weaker imagery (hypophantasia) is included. Intelligence and spatial ability are not lower: accuracy and capacity on visual working memory tasks match controls, and what differs is the strategy — verbal and spatial rather than pictorial.
Aphantasia means that when you close your eyes and try to picture an apple, no visual image appears. About 1% of the general population is affected. Intelligence and spatial reasoning are not lower — the same tasks are simply solved by a different route. This article covers prevalence, measurement, and the relationship to ability.
Definition and origin
The term aphantasia was popularized by Zeman and colleagues (2015, Cortex) in a paper describing people who had never experienced visual imagery. What it refers to is voluntary visual imagery: the image that should arise when you deliberately try to conjure one does not.
It is worth stressing that this does not mean an absence of imagination. People with aphantasia follow stories, handle metaphor, and reason about spatial relations. What is missing is the subjective picture accompanying that processing. Some still see imagery in dreams.
How common is it?
The general-population estimate comes from Dance, Ipser, and Simner (2022, Consciousness and Cognition). Crucially, they sampled the general population rather than recruiting from communities of people who already identify as aphantasic. The reported figures were:
- Aphantasia (essentially no visual imagery): about 1%
- Hypophantasia (weak imagery): about 3%
The number moves with where the questionnaire threshold sits — roughly 0.8% under the strictest criterion of no imagery at all, and around 3.9% under looser criteria. Applied to a country of a hundred million, that is over a million people.
How it is measured
The standard instrument is the VVIQ (Vividness of Visual Imagery Questionnaire): sixteen items asking you to picture scenes such as a familiar face or a sunrise and rate the vividness on a five-point scale.
Being self-report, it has limits. Answers shift depending on whether the respondent takes 'picture it' as a figure of speech or as a literal image. More recent work combines objective indicators such as pupil response and binocular rivalry.
The relationship to intelligence and spatial ability
This is the practically important part. On tasks that supposedly rely on visual imagery, people with aphantasia repeatedly perform at the same level as everyone else.
Keogh, Wicken, and Pearson (2021, Cortex) found that accuracy and capacity on a visual working memory task were retained in the aphantasic group. What differed was the self-reported strategy: controls described visual strategies, the aphantasic group described verbal and spatial ones.
Mental rotation shows the same pattern. In the case Zeman and colleagues reported, reaction times were longer while accuracy matched controls. The route takes longer, but it arrives.
The shape of this result resembles the uneven domain profiles that multiple intelligences posits. Two people can reach the same overall figure by different paths.
What it means for spatial reasoning tests
Spatial reasoning items on IQ tests are often explained as 'rotate the figure in your head.' That phrasing confuses people with aphantasia, but what the item actually measures is whether you can hold and transform the spatial relations between elements, not how vivid the picture is.
So a missing picture is not a disadvantage. In practice, tracking the correspondence — which corner moves where — is often faster than rotating anything, a procedure covered in training spatial reasoning and in the spatial reasoning examples.
Treating it as an individual difference
Aphantasia is not a diagnosis. When congenital, most people have no idea until they discover that others apparently do see something. It can affect which study methods suit you — diagrams versus words — but it does not set a ceiling on ability. This way of reading a departure from the norm as difference rather than deficit is the view taken in neurodiversity.
Look at your own cognitive profile
Domain scores offer a clue about which route you take. BrainRank's free IQ test scores 20 questions across spatial reasoning, pattern recognition, logical reasoning, and classification (about 10 minutes) using item response theory (IRT) and reports each domain separately. Because the scale is the same with or without visual imagery, it is useful material for finding the entry point that works for you. Results are estimates for entertainment and self-understanding, not a medical or diagnostic assessment.
Frequently asked questions
- What percentage of people have aphantasia?
- In a 2022 general-population survey, about 1% had aphantasia — essentially no visual imagery — and about 3% had weak imagery, or hypophantasia. Depending on where the questionnaire threshold is set, published estimates range from roughly 0.8% to 3.9%.
- Does aphantasia mean lower intelligence?
- No. Accuracy and capacity on visual working memory tasks have been shown to match those of the general population. The difference is not performance but strategy: verbal descriptions and spatial relations take the place of visual imagery.
- Is aphantasia a disorder?
- It is generally treated as an individual difference, not a diagnosis. It can be congenital or acquired after brain injury; in the congenital case it rarely causes meaningful difficulty in daily life.
Share this article
Related articles
- ADHD and IQ: Is Average IQ Lower? WISC Profiles and High-IQ ADHD
- Autism and IQ: Intellectual Disability Rates and Test Profiles
- Does Reading Raise IQ? What Twin Studies and Meta-Analyses Show
- IQ and Age: When Does Intelligence Peak? Fluid vs. Crystallized Curves
- EQ vs IQ: What's the Difference, and Which Matters More?
- Do School Phone Bans Raise Grades? What the Research Data Show
Editorial note & disclaimer
BrainRank Editorial Team
This article was written and edited by the BrainRank Editorial Team with reference to academic literature on psychometrics, including CHC theory and Item Response Theory (IRT). Statistics and percentages are calculated from a normal distribution model with a mean of 100 and a standard deviation of 15.
The tests on this site provide estimates for entertainment and self-understanding purposes only. They are not medical or clinical assessments, nor official psychological (intelligence) tests.